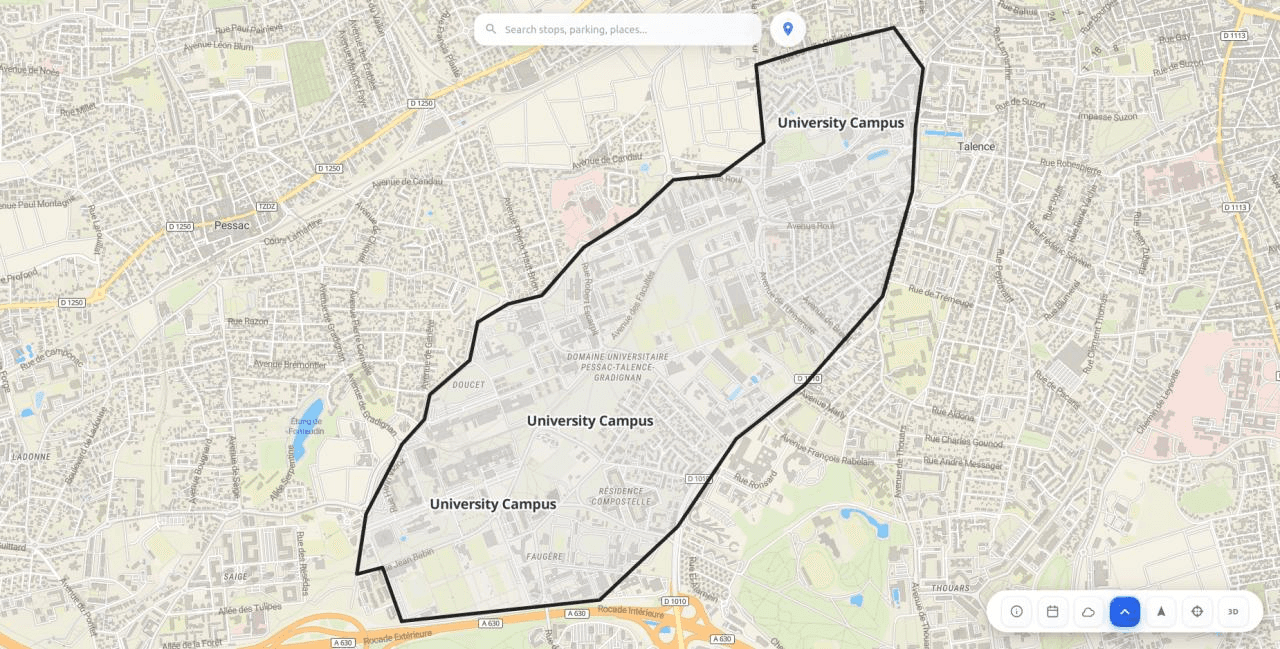
Campus Traffic Observatory
Client-side cartographic application built with SolidJS, Vite, and MapLibre GL for real-time visualization of campus mobility data: traffic, public transport, parking, bikes, weather, and air quality.
Tech Stack

SolidJS
Reactive UI framework with signals and fine-grained DOM updates

TypeScript
Type-safe application logic across frontend and build scripts

Vite
Build tool with HMR, proxy for CORS, and pre-build data pipeline

MapLibre GL
WebGL-powered 2D/3D interactive map with custom layers
Architecture
Client-side SPA built with SolidJS and Vite for fine-grained reactivity without a virtual DOM. MapLibre GL JS handles WebGL-based 2D/3D cartographic rendering. Data sourced from CEREMA, TBM GTFS, open-meteo, Bordeaux Métropole, and Overpass/OSM APIs, pre-processed at build time. Real-time polling via Vite proxy (30s GTFS-RT, 5m parking). Search runs off-thread in Web Workers with Fuse.js. Deployed on Vercel edge CDN.
Key Features
- Interactive 2D/3D map powered by MapLibre GL JS with terrain elevation and WebGL rendering
- Real-time public transport tracking (Trams & Buses) via GTFS-Realtime Protobuf decoding
- Traffic analysis with Z-score normalization and color-coded road segments
- Animated traffic simulation with cars moving along GeoJSON LineStrings using Turf.js
- Weather widget with AQI calculation following US-EPA standards (PM2.5, PM10, NO2, O3)
- Multimodal fuzzy search using Fuse.js in Web Workers with Nominatim geocoding fallback
- GTFS data pipeline compressing 160 Mo+ of transit data into optimized JSON at build time
- Parking and bike-sharing (VCUB) station availability from Bordeaux Métropole open data
- 4-level test strategy: unit (Vitest), integration, component, and E2E (Playwright)
- CI/CD with GitHub Actions, Vercel edge deployment, and proxy rewrites for CORS handling