Campus Mobility Analysis
React cartographic interface for campus mobility data analysis and visualization, with video processing and metrics extraction via Python/YOLO.
Tech Stack

Next.js
Frontend framework with routing and rendering optimizations

React
Component-driven UI and state management

Leaflet
Interactive mapping with markers, popups, and heatmaps

D3.js
Custom analytical charts and distributions

FastAPI
Python REST API with documented endpoints

Python
Backend logic, analytics, and video-processing scripts

YOLO
Real-time object detection for mobility analysis

PostgreSQL
Persistent storage for sensors and aggregated data
Architecture
Client-server architecture with a Next.js frontend built on React and TypeScript, Leaflet for mapping, and D3.js for data visualization. The backend is a Python FastAPI REST API connected to PostgreSQL through SQLAlchemy. Video analysis relies on YOLOv11 and ByteTrack, and the platform is organized around Receiver and Simulator workflows.
Key Features
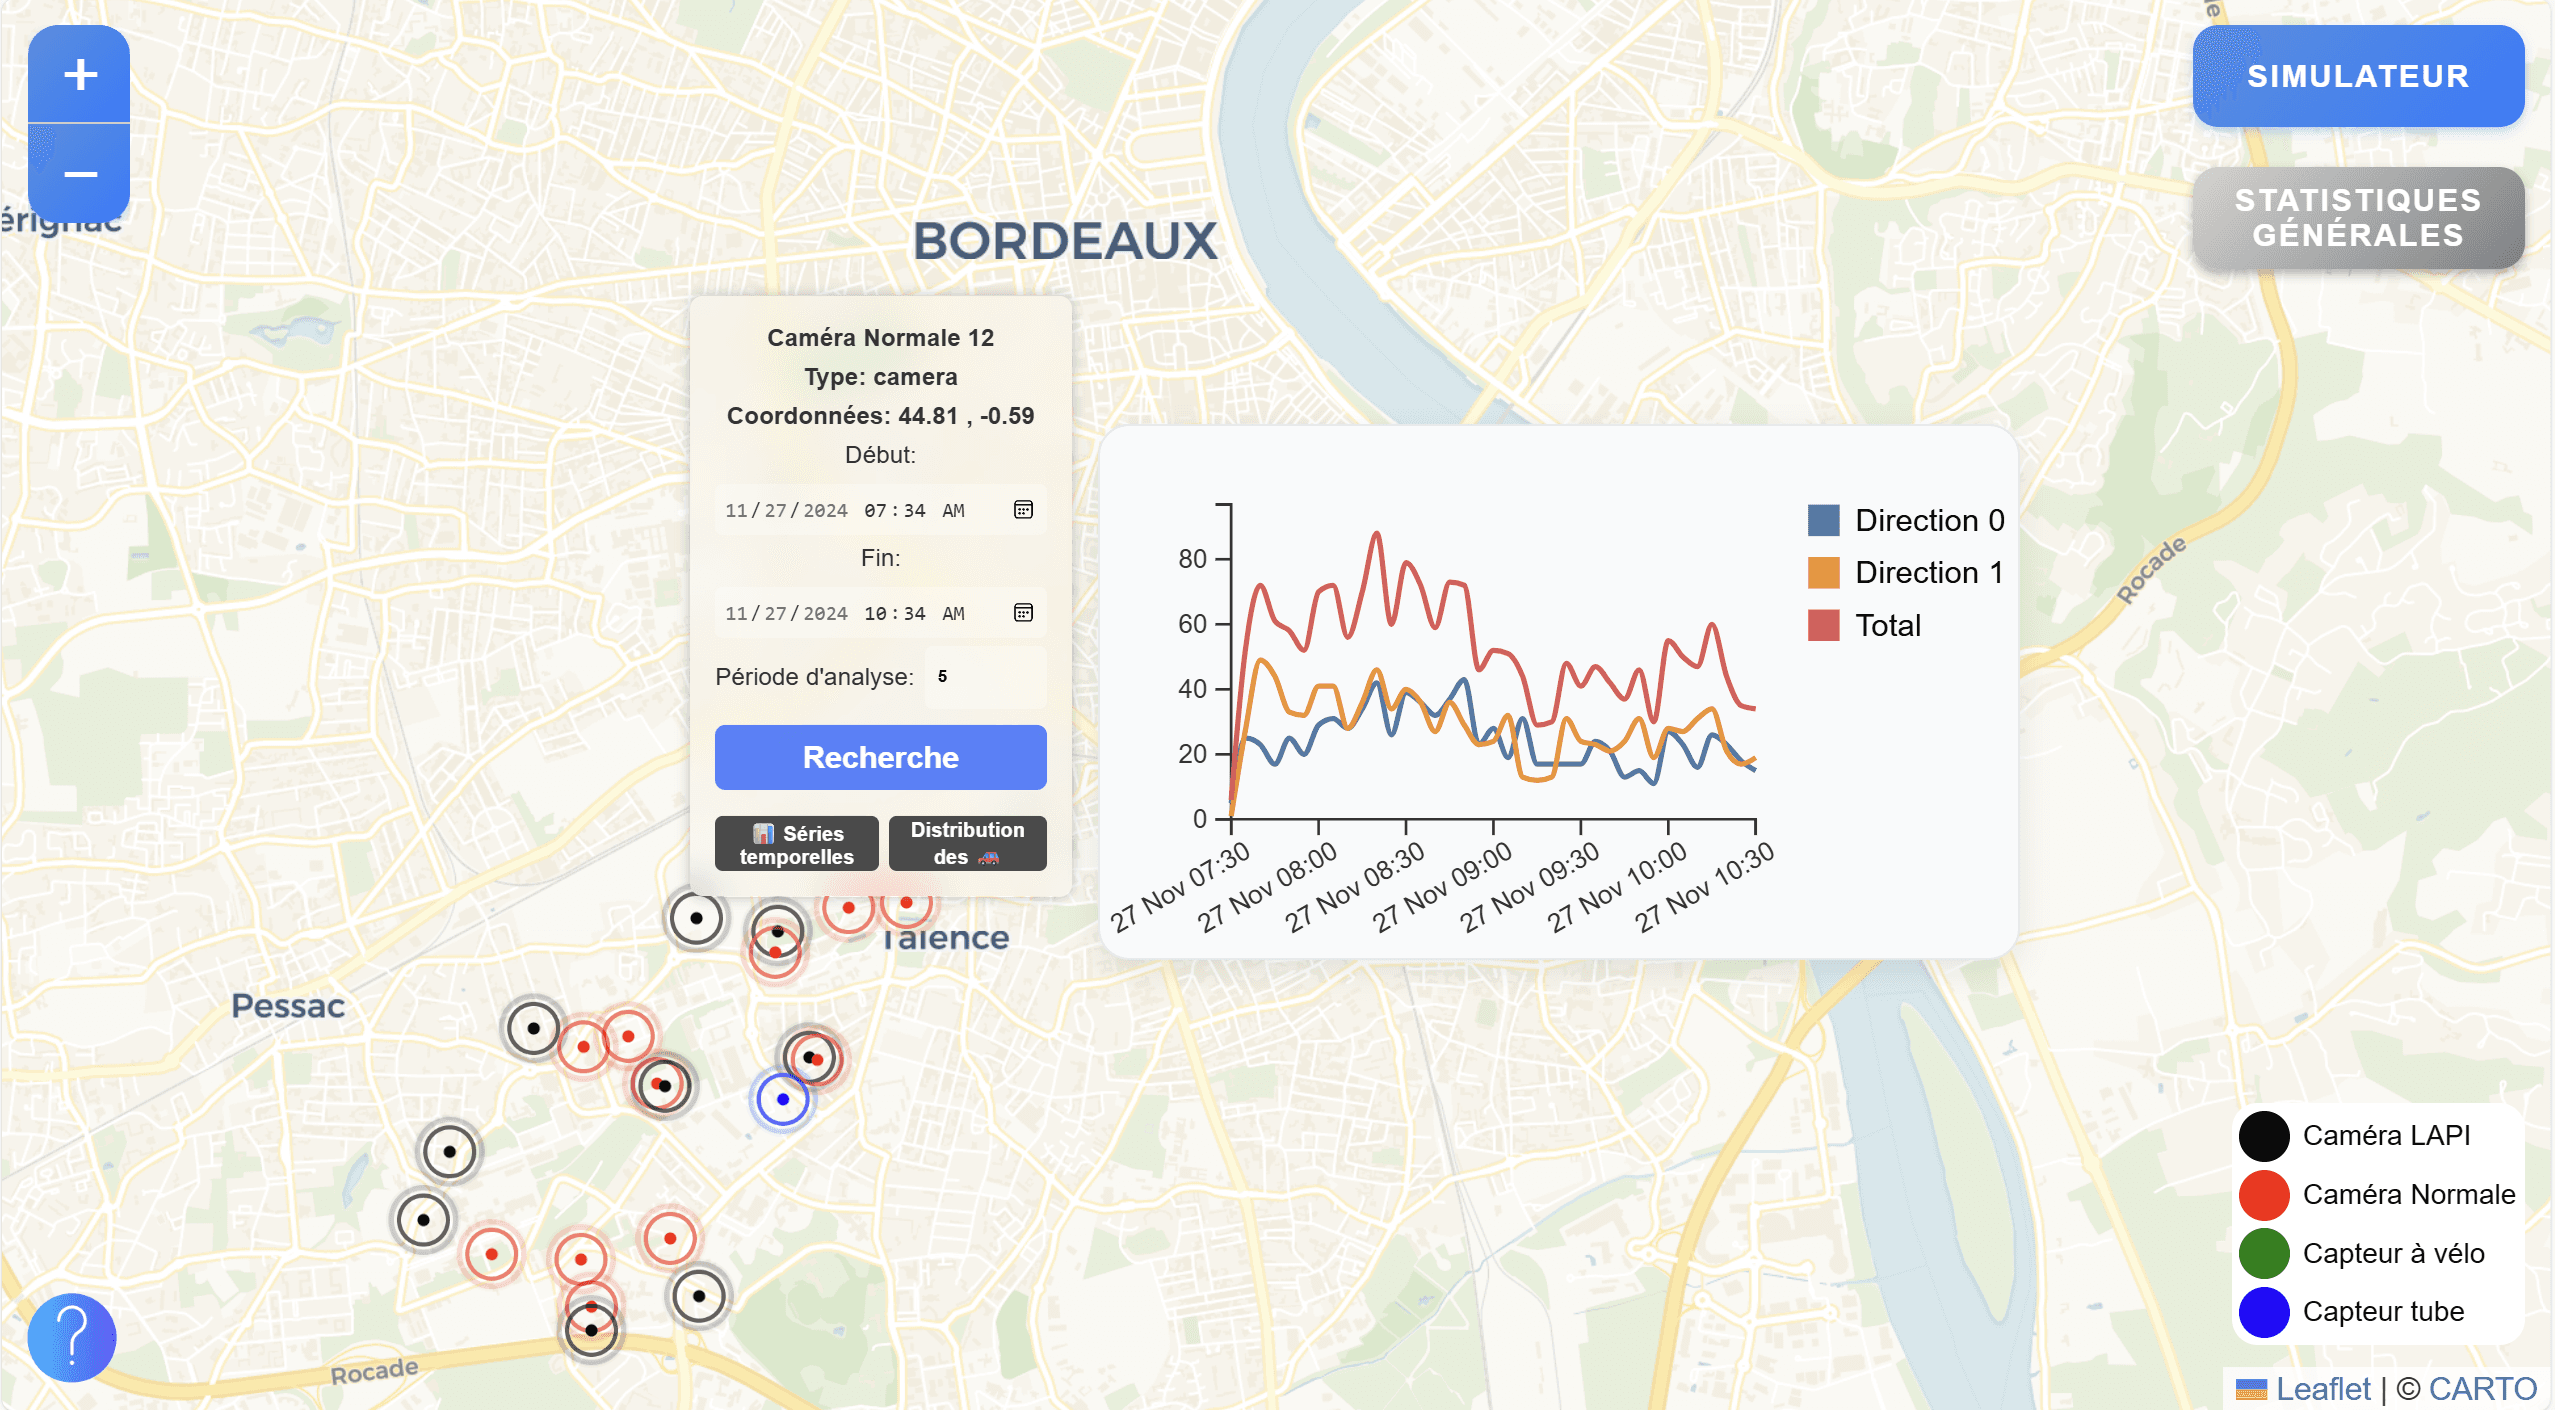
- Interactive Leaflet map with OpenStreetMap tiles for campus sensor visualization
- Dual interface with Receiver mode for imports and sensor management, and Simulator mode for analytics
- Vehicle detection from videos using YOLOv11 combined with ByteTrack tracking
- Custom fine-tuning to add scooter detection to the base model
- Statistical filtering using z-score normalization to remove anomalies and duplicates
- D3.js charts for temporal series and vehicle-type distribution
- Heatmap visualization with quantile-based traffic density coloring
- FastAPI backend handling sensor CRUD, CSV uploads, and aggregated statistics
- Multi-threaded video processing for long recordings
- Agile project organization with weekly sprints and client reviews